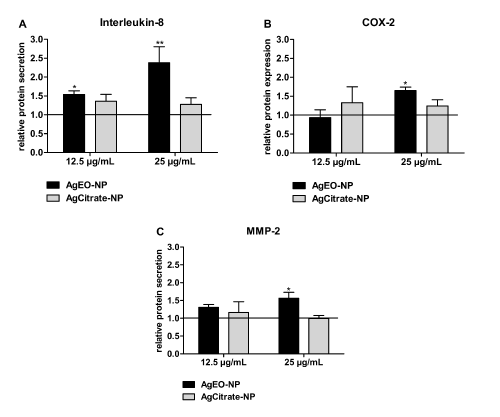
A) relative protein secretion of Interleukin-8.
B) relative protein expression of COX-2.
C) relative protein secretion of MMP-2.
|
| Figure 8: Protein expression of various inflammation markers after treatment of PBCEC with AgEO- and AgCitrate-NPs for 24 h. Values are relative to the
untreated control. Data are represented as means ± SEM, n ≥ 3. A) relative protein secretion of Interleukin-8. B) relative protein expression of COX-2. C) relative protein secretion of MMP-2. |