 |
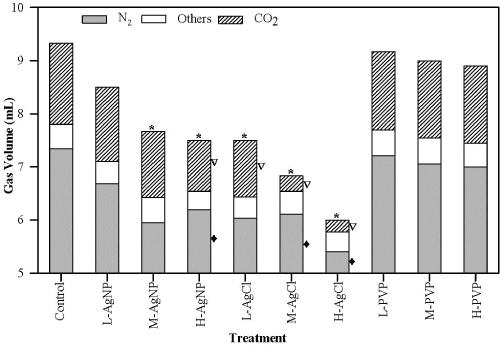
| Figure 2:Carbon dioxide (CO2) and nitrogen (N2) gas recovered from the total gas generated by the human therapeutic intestinal bacterial communities after 48 h exposure to silver nanoparticles (AgNPs), silver chloride (AgCl), polyvinylpyrrolidone (PVP) and control (with no Ag or PVP), where L, M and H before AgNP and AgCl represent 25, 100 and 200 mg/L and L, M, H before PVP represent 2.5, 10 and 20 mg/L concentrations, respectively, in the X-axis. The symbols ’*‘, ’∇‘ and ’♦‘ show significance differences (p<0.05) in the total gas volume, CO2 and N2, respectively, compared to the control. |