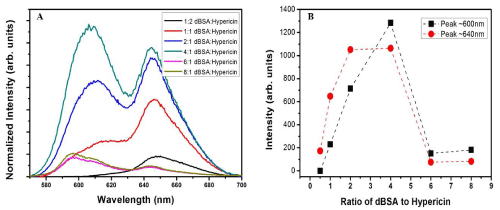
Figure 4: Hypericin conjugation with BSA
- Absorption spectra of different concentration ratios of the dBSA:Hypericin complex (A). Scatter plot displaying maximum intensity of absorption bands with the concentration ratio of 4:1 (B).