 |
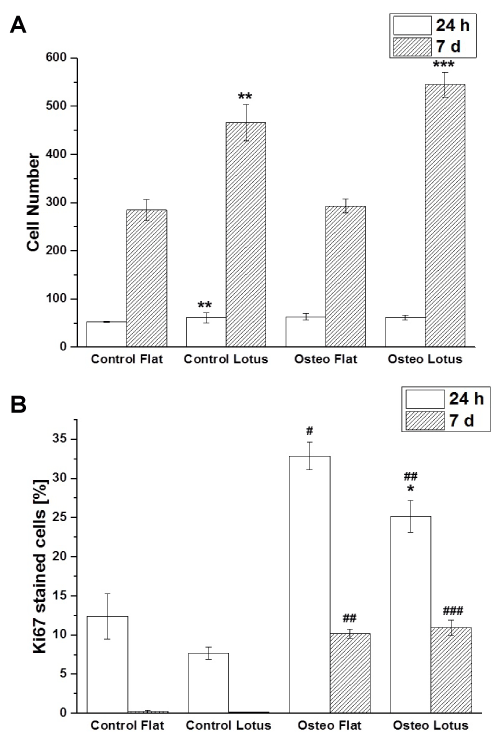
| Figure 4: (A) Quantification of adherent cell number on the entire surfaces; (B) analysis of the proliferative activity quantified by the relative amount of Ki67 stained cells. After 24 h control and predifferentiated were compared; after 7 d control and osteogenic cells. Initial cell densities [cells/well] of 2.5x10⁴ and 1x10⁵, respectively. The results are given as average ± s.e.m of four independent measurements. Student’s-t-test was applied with significant levels of p< 0.05, p < 0.01, p < 0.001 to compare the impact of the topography (*) and differentiation (#). |