 |
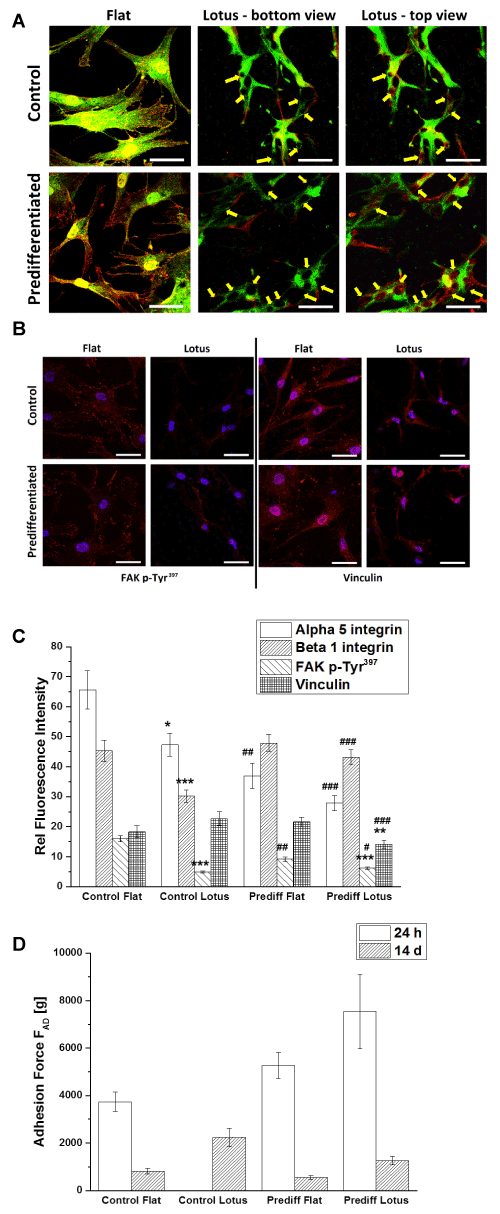
| Figure 5: Surface impacts on cell adhesion after 24 h (scale bars = 50 μm). Fluorescence images of (A) α5 (green) and Β1 (red) integrins (yellow arrows indicate tip of microsized surface features) and of (B) FAK p-Tyr397 (red) and vinculin (red) stained cells; nuclei are stained in blue. (C) Quantification of α5 and Β1 integrins, FAK p-Tyr397 and vinculin. The results are given as average ± s.e.m. of at least 50 cells / treatment of four independent measurements.(D) Analysis of adhesion force properties via centrifugation detachment assay after 24 h and 14 d of cultivation. The results are given Adhesion Force FAd[g] and shown as average ± s.e.m. of obtained of four independent measurements.Student’s-t-test was applied with significant levels of p < 0.05, p < 0.01,p < 0.001 to compare the impact of the topography (*) and differentiation (#). |