 |
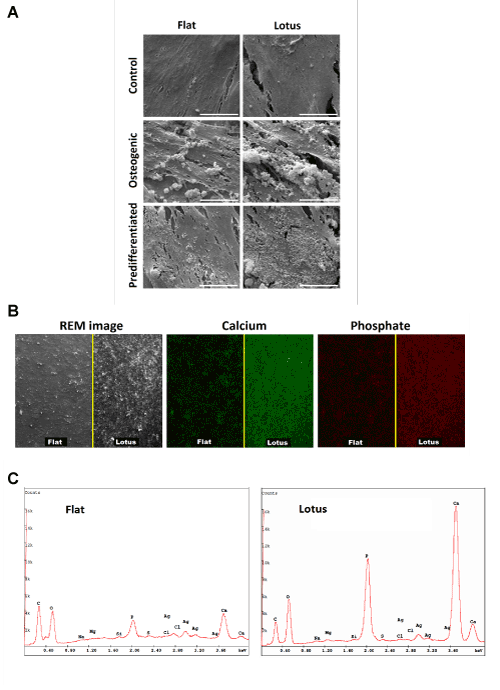
| Figure 7: Analysis of calcium mineralization after 21 d. (A) SEM images (scale bars = 20 μm); (B) images used for EDX mapping of osteogenic cells, which show calcium (green) and phosphate (red); (C) corresponding EDX mapping for the detection of calcium and phosphate. |