 |
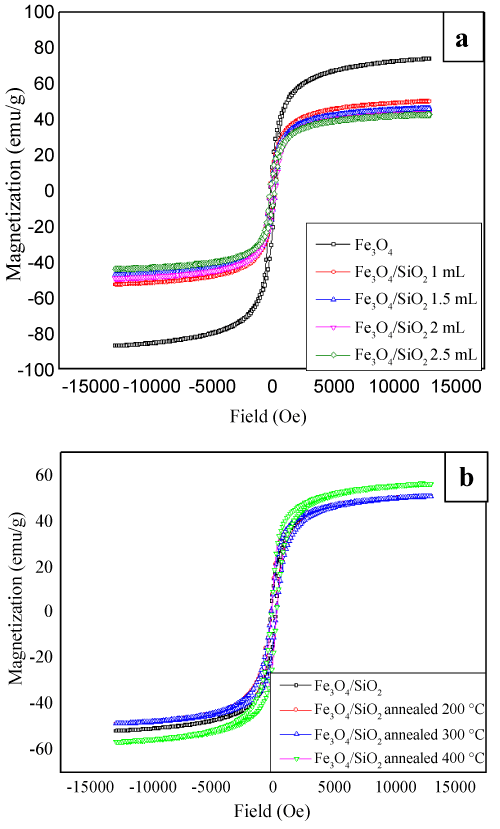
| Figure 9: The magnetization curves for both Fe3O4 nanocube and Fe3O4/SiO2 nanocube with different TEOS amount (1, 1.5, 2, and 2.5 mL) measured by VSM at 300 K in case of (a) after 4 month of exposure to air and (b) after annealed the sample at different temperatures in presence of H2 gas. |