 |
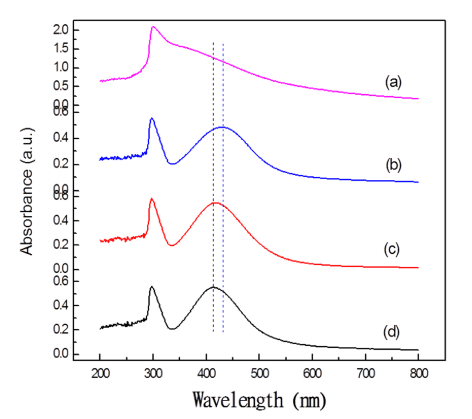
| Figure 2: The optical absorbance spectra of the colloidal silver nanoparticles are shown, where curves (a), (b), (c) and (d) are corresponding to the samples A0, A1, A2 and A3 prepared with capping amount PVP as 0.025gm, 0.05 gm, 0.1 gm and 0.2 gm; respectively. |