|
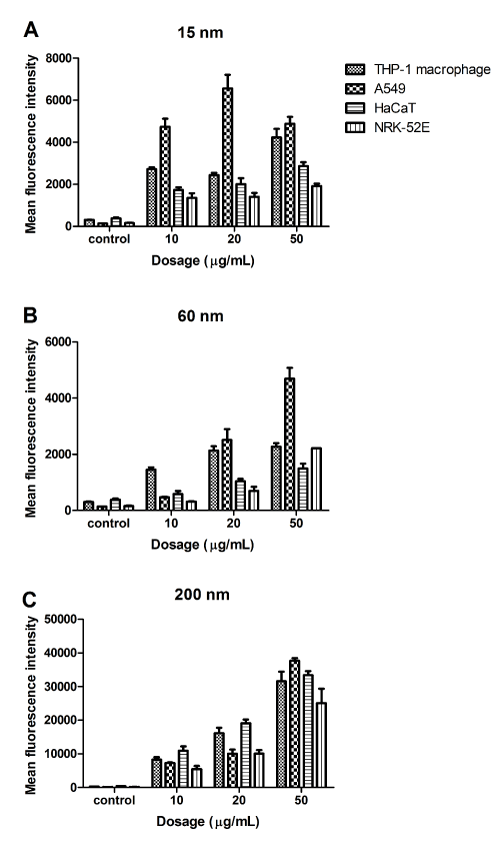
| Figure 5: Dose dependent quantification of cellular uptake using flow cytometry. Cells were treated with 0, 10, 20 and 50 μg /mL of 15 nm (A), 60 nm (B) or 200 nm (C) SiO2 NP for 24 h in THP-1 macrophages, A549, NRK-52E and HaCaT cells. Uptake was quantified using flow cytometry as mean fluorescence intensities of the cells. Data are presented as means ± SEM of at least three independent experiments. |