 |
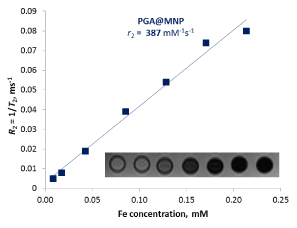
| Figure 7: Transverse relaxation rate (R2=1/T2) of the PGA@MNP sample as a function of iron concentration and the resulting r2relaxivity value. Inset: T2- weighted image of samples in phantom water (TR=3000 ms, TE=40 ms, Fe concentration increases from left to right). |