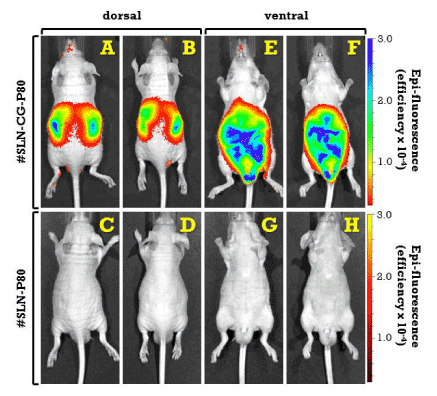
Figure 7 :Optical images of athimic mice after intraperitoneal injection of 500
μl of #SLN-CG-P80. Images were recorded after 4 h from the injection.
In vivobody distribution of lipid nanoparticles, as determined by fluorescent
luminescent imaging technology of total body.Pictures show the images
collected from 2 representative animals that were treated, as described in
the experimental section, with a dispersion of nanoparticles by intraperitoneal
administration.
Dorsal (A-D) and ventral (E-H) images were recorded after the administration
of fluorescent nanoparticles (#SLN-CG-P80) (A, B, E, F) or blank, control
nanoparticles (#SLN-P80) (C, D, G, H). Colour bar on the right side indicates
the signal efficiency of the fluorescence emission coming out from the animal.
For nanoparticle identification codes, composition and preparation procedure,
please refer to Table 1 and experimental section. |
