 |
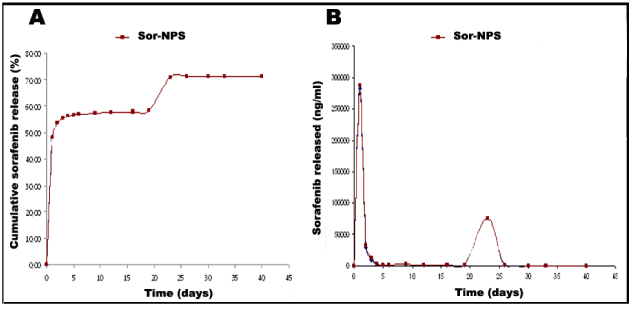
| Figure 2: In vitro sorafenib release from Sor-NPs. A) Time course of thecumulative percentage of sorafenib released. B) Sorafenib released over the time. Values are represented as mean (± standard deviation, SD) from three batches of each formulation. |