 |
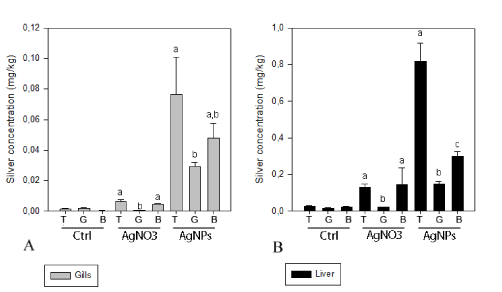
| Figure 4 : Silver concentrations (mg/kg wet wt.) in gills (A) and liver (B) of rainbow trout exposed to AgNPs and AgNO3. T=Tap water, G=Green water, B=Brown water, Ctrl=control, AgNO3=dissolved silver and AgNPs=silver nanoparticles. Letters represent significant differences between silver concentrations among the three types of water for each treatment. “a” is significantly different from “b” and from “c”. Significant silver bioaccumulations were observed with both silver forms between exposed and control treatments (p<0.05) for the three types of waters except with AgNO3 in liver with green water. Error bars correspond to standard error. *p<0.05. |