 |
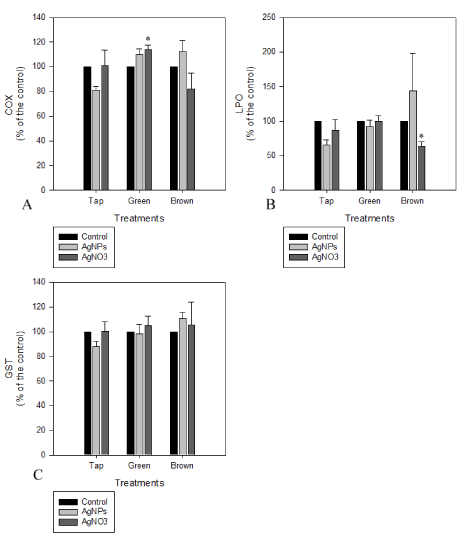
| Figure 7: Biochemical biomarkers of fish hepatocytes exposed to different types of water and contaminants. A) Cyclooxygenase activity (COX), B) Lipid peroxidation (LPO), C) Glutathione-S-Transferase (GST). Results are presented as a percentage of the control, where histogram represents mean ± standard error, n=5. Stars indicate differences between exposed vs non exposed treatments for each type of water. Only significant differences were indicated. |