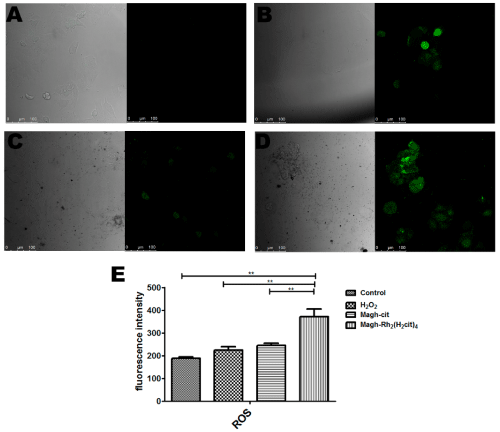
Figure 4: Effects of nanoparticles on ROS levels in breast cancer cells : The control group consisted of untreated cells (A). Hydrogen peroxide (100 mM for 20 min) was used as positive control (B). The cells (MCF-7) were treated with 0.019 mol/L (iron) maghemite nanoparticles loaded with citrate (Magh-cit) (C) or 300 μM Rh2(H2cit4)-loaded maghemite NPs [Magh-Rh2(H2cit)4] (D) for 1.5 h). Intracellular ROS levels were measured by DCFDA fluorescence intensity (E). **p<0.01, compared with the untreated control group using One-way analysis of variance (ANOVA) followed by Tukey’s multiple post hoc comparison.