 |
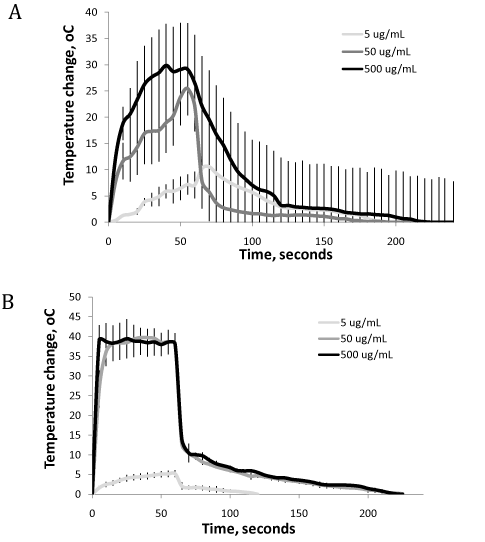
| Figure 4: Temperature change and cooling profile of HNPs suspended in 2% agar phantom. Irradiation time fixed at 60 seconds. Temperature change measured using A) thin wire thermocouples and B) infrared camera. All temperature changes quoted in relation to control sample (n=3, ±SD). |