|
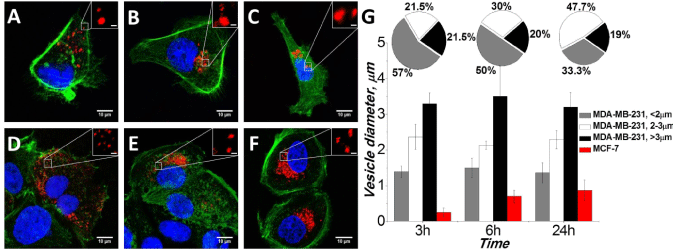
| Figure 2: Uptake of non-targeted QDs in breast cancer cells. Fluorescence confocal micrographs of MDA-MB-231 cells (A, B, C) and MCF-7 cells (D, E, F) after 3, 6 and 24 h treatment with QDs. White squares mark the zoomed parts shown in the inserts. Inserts’ scale bar=1 μm. The red color shows QDs, the green color – actin staining, the blue color – nucleus staining. G – diameter of vesicles inside MCF-7 and MDA-MB-231 cells, evaluated by image analysis of micrographs. |