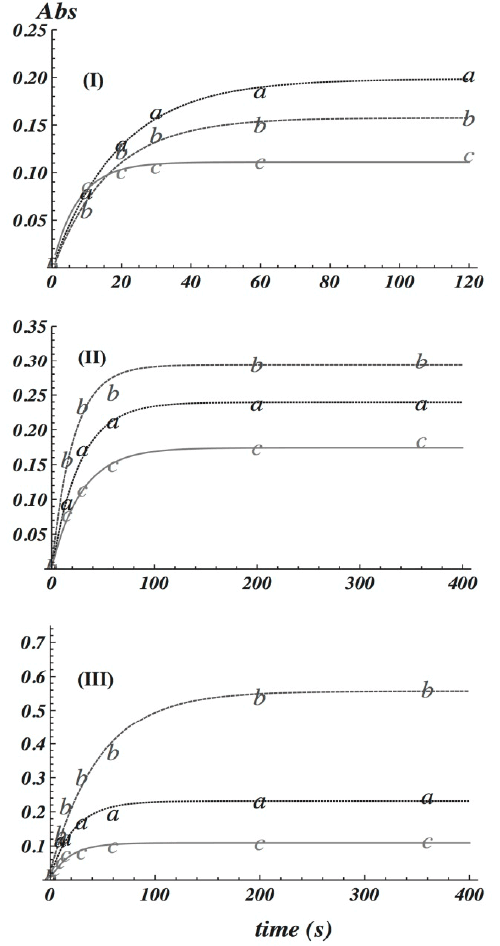
Symbols (a), (b) and (c) stand for experimental points for, respectively, pH values of 4.5, 7.0 and 10.0.
 |
| Figure 11: (I) BSA adsorption onto NT-TiO2. (II) BSA adsorption onto CaP.nT-TiO2. (III)
BSA adsorption onto Sr.CaP.nT-TiO2. Symbols (a), (b) and (c) stand for experimental points for, respectively, pH values of 4.5, 7.0 and 10.0. |