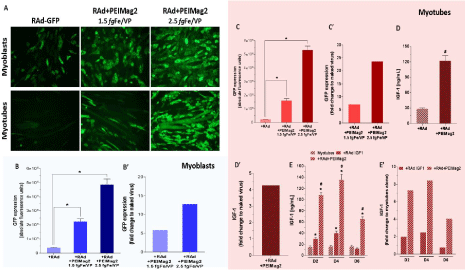
Figure 4: Magnetofection enhances viral vector-mediated gene delivery in
C2C12 myoblasts and myotubes: C2C12 myoblasts and fully differentiated
myotubes were incubated with either naked recombinant adenoviral vectors
(RAd-GFP or RAd-IGF-1) or RAd+MNPs complexes (RAd+PEIMag2)
and exposed to an optimal magnetic field for 30 minutes. To assess gene
delivery efficiency, GFP expression was evaluated using microscopy imaging
and fluorescence quantitation 48 hours after infection for both groups. In
a similar manner, IGF-1 levels were measured in the culture medium by
radioimmunoassay. A Representative microscopy images of myoblasts
(upper panels) and myotubes (lower panels) infected with RAd-GFP and RAd-
GFP+MNPs at 1.5 and 2.5 fgFe/VP MNP-to-Viral Particle ratios. After imaging,
cells lysates were used to perform quantitation of GFP expression. Comparison
between conventional viral transduction and magnetofection was plotted as
absolute B and C and relative-to-naked virus fluorescence levels B’ and C’.
Unspecific signal from cells alone, MNPs and lysis buffer were subtracted
to each group previous to data analysis. To assess magnetofection efficacy
with RAd-IGF-1, culture medium from myotubes was collected 48 hs after
gene transfer protocols and processed for IGF-1 extraction and quantitation.
Comparison between conventional viral transduction and magnetofection was
plotted as absolute D and relative-to-naked virus concentration D’. IGF-1 basal
levels in myotubes alone, as well as unspecific readings from extraction buffer,
were subtracted to both experimental groups in order to show only viral vectormediated
IGF-1 production. In a subset of myotubes, IGF-1 expression was
analyzed in the culture medium at days 2 (D2), 4 (D4) and 6 (D6) after gene
delivery and compared between non-infected, transduced with naked virus and
magnetofected cells. Plots show absolute E and relative-to-myotubes alone E’
IGF-1 levels for each time point.
*Statistically significant difference with p < 0.05 between non-infected myotubes
and naked virus or magnetofection groups. #Statistically significant difference
with p < 0.05 between naked virus and magnetofection groups. Data values
represent mean ± S.E.M. n=3 for GFP groups, n=4 for IGF-1 at 48 hs and n=6
for IGF-1 longitudinal analysis. fgFe/VP=femtograms of iron per Viral Particle |
