 |
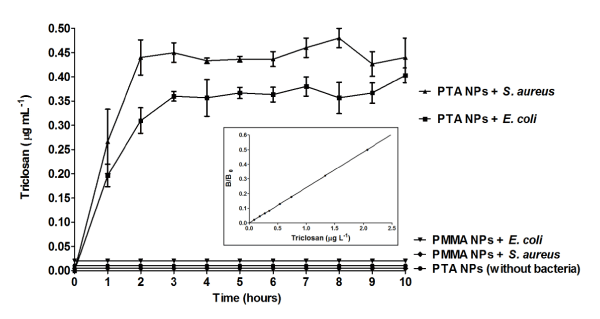
| Figure 7: Direct NPs-cells interactions induced Triclosan release from PTA NPs. Monitoring of total triclosan released from PTA NPs (50 μg mL-1) incubated with E. coli and S. aureus. PTA incubated without bacteria served as control. Error bars represent the standard deviation of three independent experiments conducted in triplicate. The Inset represents a dose-response curve of absorbance vs. triclosan concentration, generated using results obtained from standard solutions. Triclosan concentration present in the main figure was determined directly from this curve. |