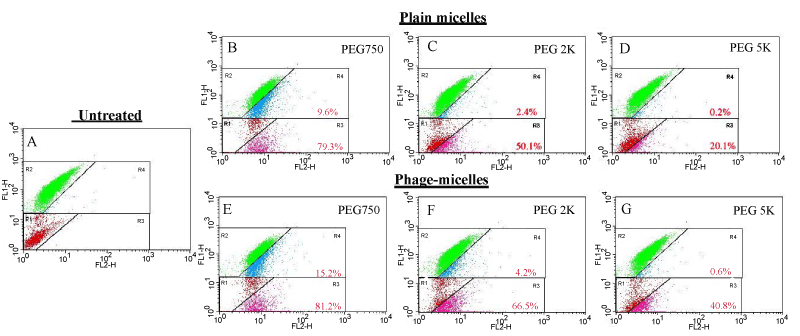
Figure 3: FACS analysis of cellular binding of micellar formulations
prepared with different PEG blocks in a co-culture system. A co-culture
composed of target MCF-7 cells and non-target C166-GFP cells was treated
for 1h with either plain micelles or phage-micelles constructed from PEG750-
PE, PEG2k-PE, or PE EG5k -PE conjugates, followed by FACS analysis of cellassociated
micelles as indicated by the red fluorescence increase. The dot plots
were bounded into four regions (R1, R2, R3, and R4). FL1-H (green); FL2-H
(red);
(A) A representative dot plot showing the untreated co-culture of MCF-7 cells
and C166-GFP cells. Red dots in region R1, the location of untreated MCF-7
cells; green dots in region R2, the location of untreated C166-GFP cells; (BD)
Plain micelle-treated co-culture of MCF-7 cells and C166-GFP cells. Pink
dots in region R3, plain micelle-associated MCF-7 cells; blue dots in region R4,
plain micelle-associated C166-GFP cells; (E-G) MCF-7-targeted phage-micelletreated
co-culture of MCF-7 and C166-GFP cells. |
