|
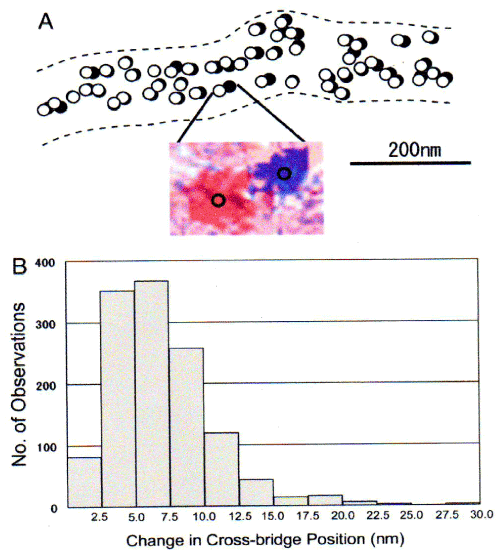
| Figure 9: ATP-induced myosin head movement. (A) Comparison of the myosinhead position between the two IP records, taken before and after application of ATP. Open and filled circles (diameter, 20nm) are drawn around the center of mass positions of the same particle before and after ATP application, respectively. Inset is an example of superimposed IP records showing the change in position of the same gold particle, colored red (before ATP application) and blue (after ATP application) [24]. (B) Histogram showing the amplitude distribution of ATP-induced myosin head movement. |