 |
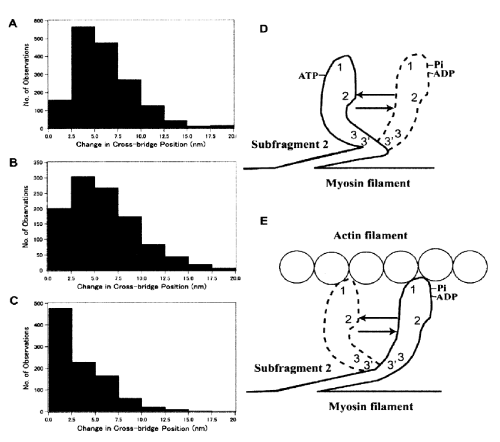
| Figure 13: (A―C) Histograms showing the amplitude distribution of ATPinduced myosin head movement, position-marked with antibody 1 (A), antibody 2 (B), and antibody 3 (C). (D and E) Diagrams illustrating myosin head lever arm mechanism in the absence of actin filament (D) and in the presence of actin filamentE. Approximate attachment regions of antibodies 1, 2 and 3 are indicated by numbers 1, 2 and 3 and 3’, respectively [26]. |