 |
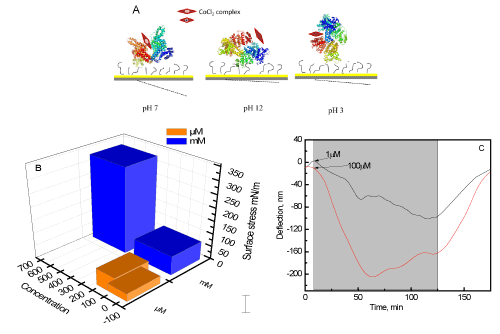
| Figure 4: Schematic of deflection of cantilever at various pHsdue to induced conformational change by binding of cobalt ions (A); 3D bar graph showing the difference in surface stress measured at μM (orange) and mM (blue) concentrations (B); Injection of micro molar concentrations showing deflection of HSA immobilized cantilevers at pH 7 (C). |