 |
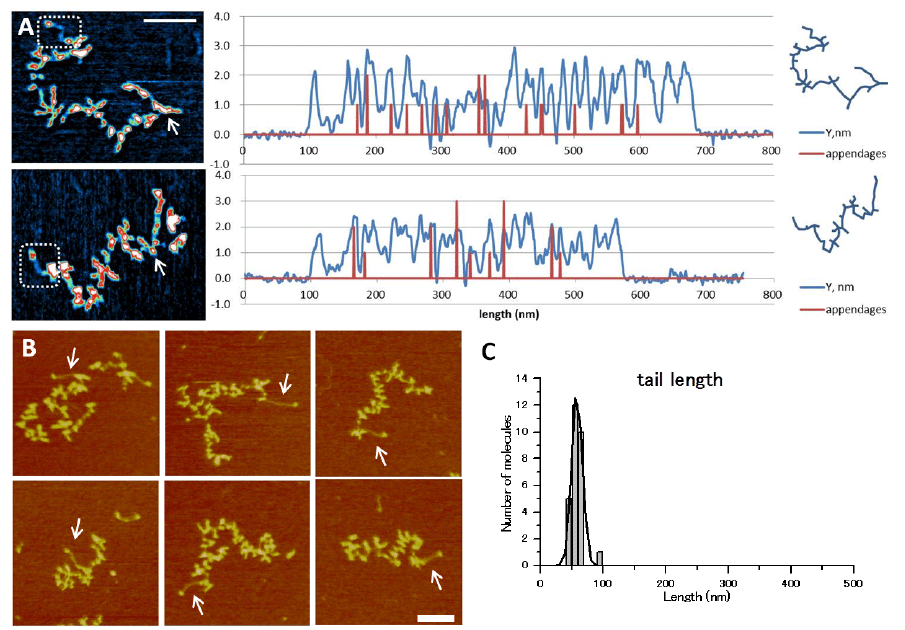
| Figure 4: Imaging and analysis of importin-β ssRNA secondary structure. Representative 1.5×1.5 μm2 images with a gallery of three 0.4×0.4 μm2 images of importin-β mRNA without (A) and with (B) the poly A tail. (C) A histogram of the length of the poly(A) tail of the molecules in (B). (D) A graph demonstrating how the length of four different ssRNA molecules relates to the measured volume. Bars represent the standard deviation of the gaussian distribution. (E) Representative images of 18S and 28S rRNA molecules. All scale bars=100 nm. |