 |
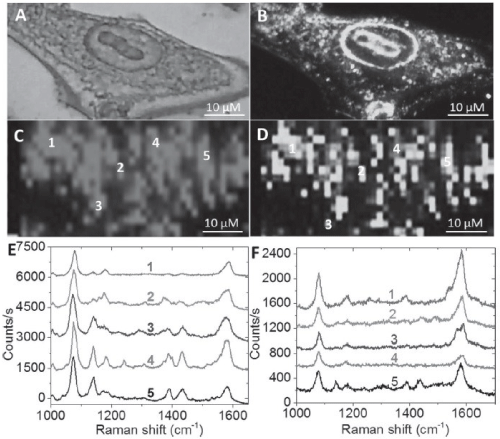
| Figure 4: Plasmonic core-shell GNP as SERS tag: Bright-field (A) and Darkfield (B) images showing intense Rayleigh scattering from BRIGHTs. SERS images mapped with 785 nm excitation (C) and 633 nm excitation(D). (E and F) Representative SERS spectra of the spots marked in (C) and (D) respectively, showing higher SERS intensity with 785 nm (E) excitation than with 633 nm (F) [22]. |