 |
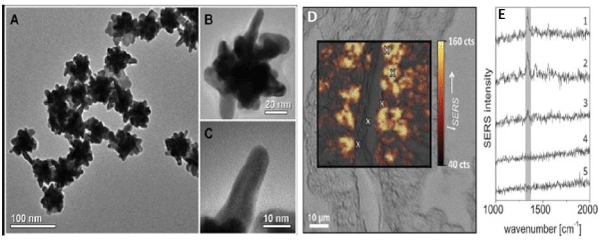
| Figure 5: Multibranched GNP as SERS tag: TEM images of 60 nm gold nanostars (A), a single gold nanostar (B) and one of its tips (C) at larger magnification, (D) White light image of a prostate tissue specimen with an overlaid SERS false colour image based on the intensity of the 1340 cm-1Raman marker band of the SERS label. (E) Five representative SERS spectra from different locations in (D), indicated by white crosses in the SERS false colour image (from top to bottom). [Reprinted with permission from RSC Publications [23]. |