 |
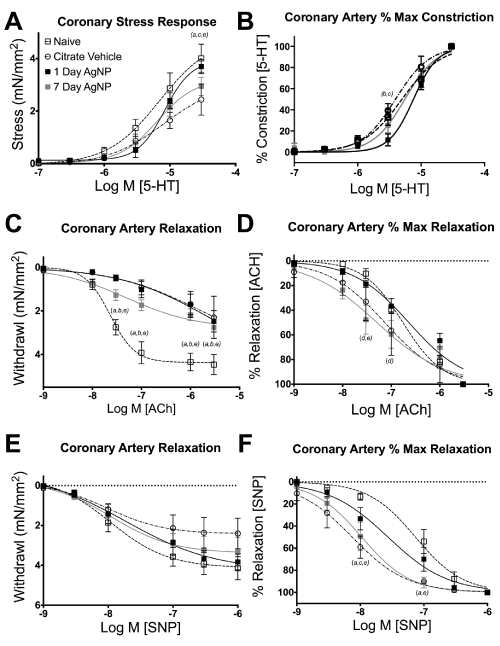
| Figure 6: Coronary artery myography responses. Pharmacologic responses of coronary artery segments including: maximal stress response to 5-HT (A), and percent maximal constrictor response to 5-HT (B), maximal stress relaxation to ACh (C) and SNP (E), Percent relaxation of maximal stress to ACh (D) and SNP (F). Significance expressed as p<0.05 as follows: (a) Naïve vs Citrate vehicle, (b) Naïve vs. 1 day, (c) Citrate vehicle vs 1 day AgNP, (d) 1 day vs 7 day AgNP, (e) Naïve vs 7 day AgNP. Data are reported as mean ± SEM with n=4–6, Lines represent the nonliner Hill fit to the mean values. |