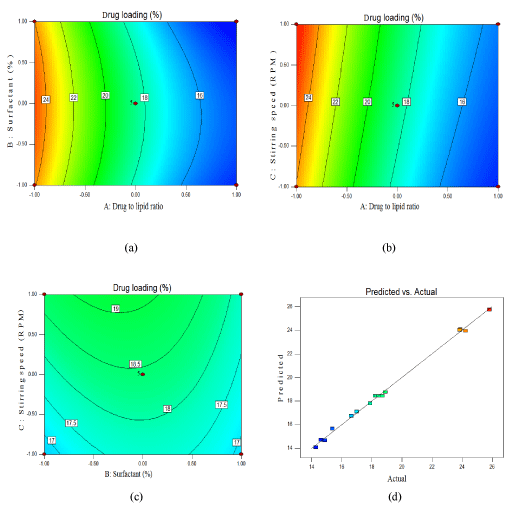
Figure 3:
(a-c) Contour plots showing relative effects of different process parameters on percent drug loading (d) plot of predicted vs. actual values for drug loading.