|
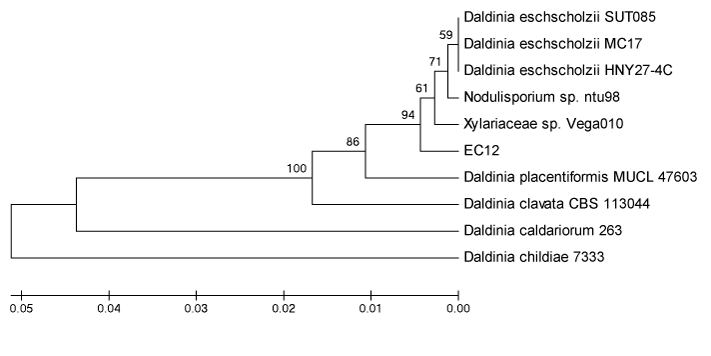
| Figure 2:A Phylogenetic tree, depicting the evolutionary position of the endophyte EC12, was constructed using the UPGMA method [11]. The percentage of replicate trees in which the associated taxa clustered together in the bootstrap test (500 replicates) is shown next to the branches [5]. The tree is drawn to scale, with branch lengths in the same units as those of the evolutionary distances used to infer the phylogenetic tree. The evolutionary distances were computed using the Maximum Composite Likelihood method according to Tamara et al. [17] and are in the units of the number of base substitutions per site. All positions containing gaps and missing data were eliminated from the dataset (Complete deletion option). |