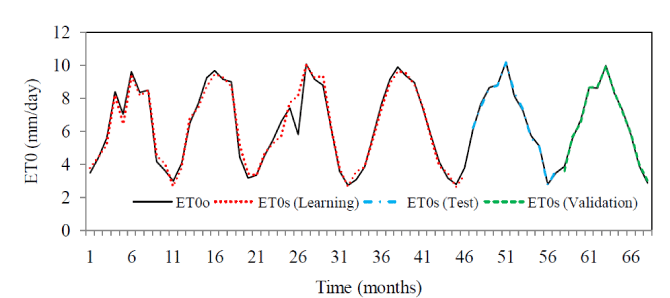
Figure 5:
Graphical comparison between observed ET0 and simulated ET0 in different phases (single neuron).