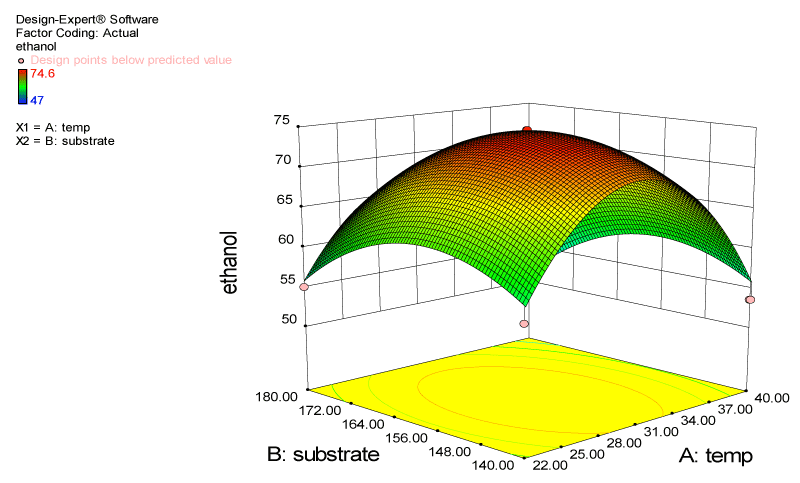
Figure 3:
Response surface and contour plot showing the effect of temperature and substrate concentration on ethanol production.