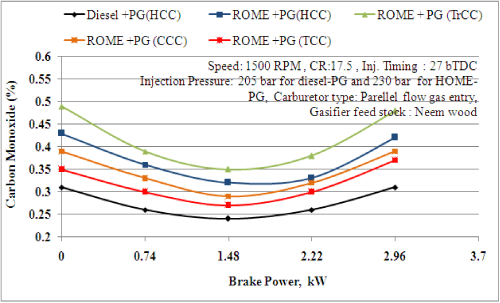
Figure 9:
Variation of CO with BP.