 |
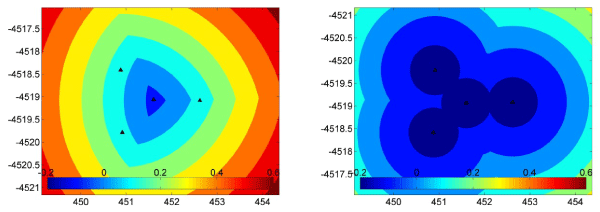
| Figure 3: Sensitivity to location (left) and detection (right) power of a test network, which seismic stations are represented by black triangles) for earthquakes located at 2 km b.s.l. The color represents the value of the minimum magnitude needed for an earthquake in that position to be located/detected by the network. |