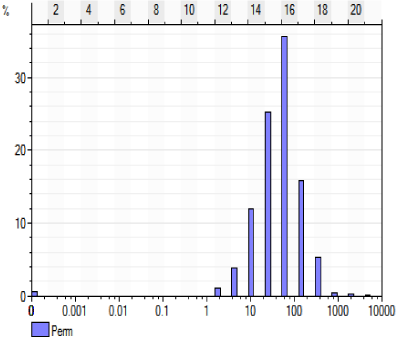
Figure 12:
Histogram of permeability distribution.