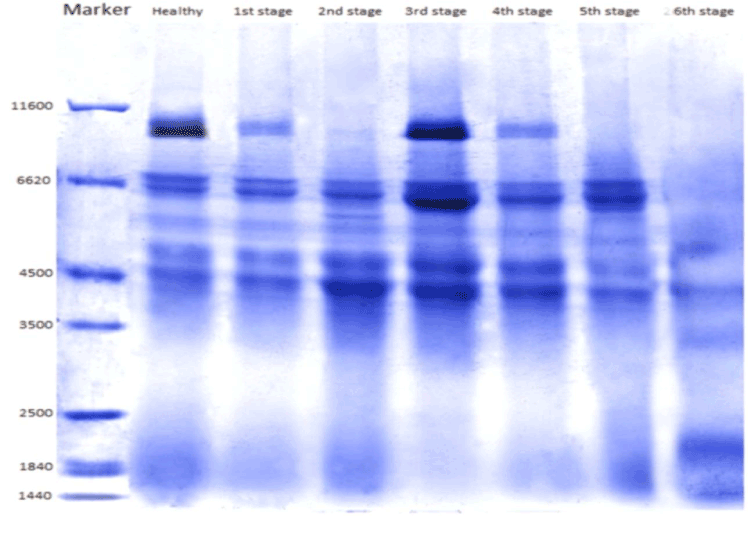
Figure 2:
Analysis of total protein content on SDS-PAGE (10 %) showing the variable protein levels at different stages of leaf gall formation in
A. scholaris
(* Showing differences in protein levels at early and older stages).