 |
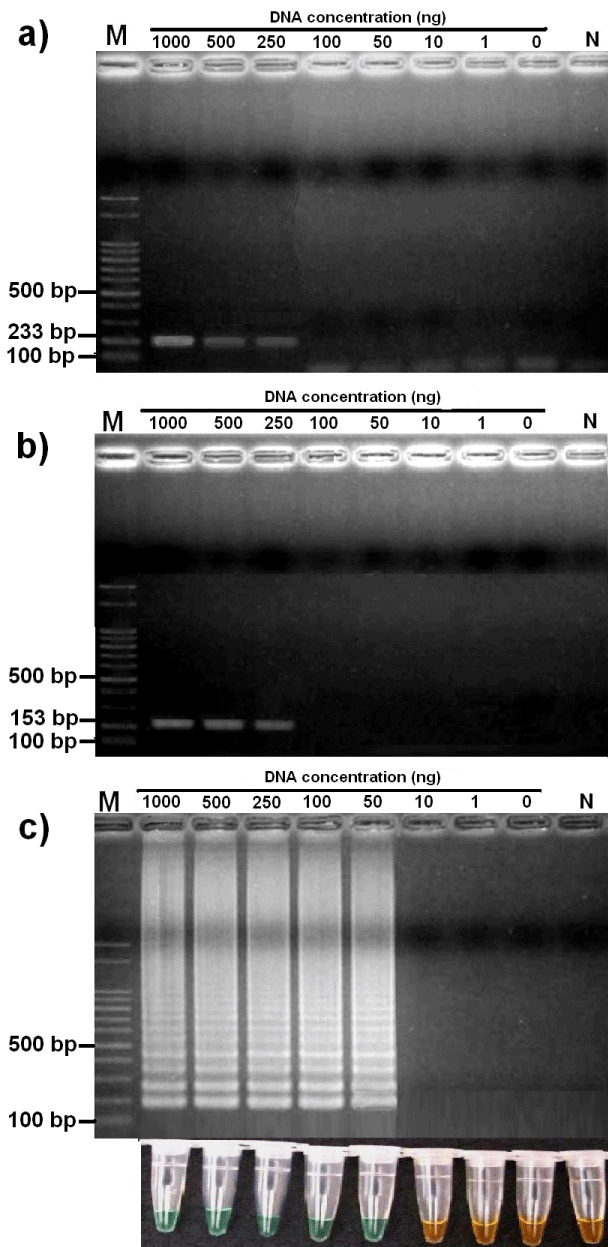
| Figure 6: Comparative analysis of the sensitivity of LAMP and PCR, using a seven dilution series of DNA as template (a) Electrophoresis analysis of PCR with F and B primers; (b) Electrophoresis analysis of PCR with F3 and B3 primers; (c) Electrophoresis analysis and visual detection (GeneFinder™) of LAMP. Left to right: Lane M, DNA size marker (100 bp; Fermentas); Lane N negative control (water). |