 |
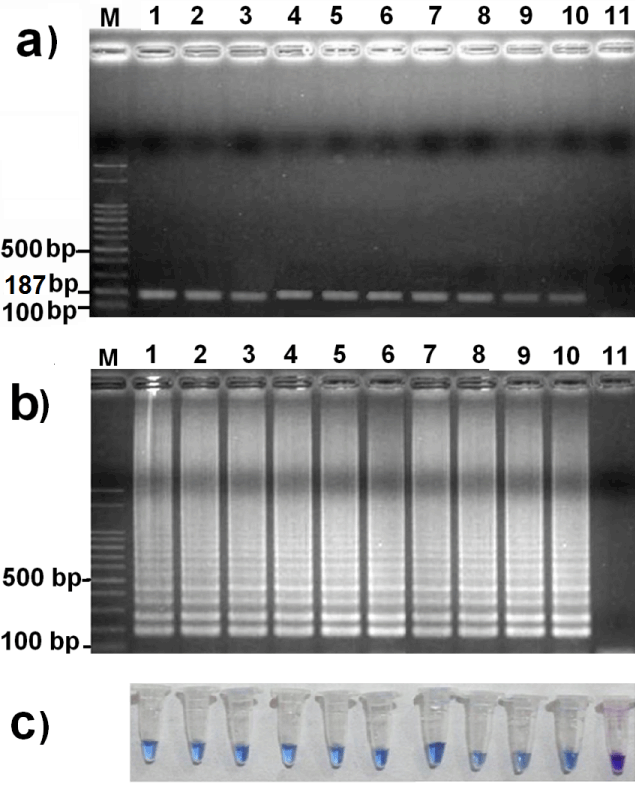
| Figure 1: Gel electrophoresis pattern on 1.5 % agarose gel (a) IC-PCR assay; (b) IC-LAMP assay; (c) visual detection by HNB. Left to right: lane M, DNA size marker (100 bp; Fermentas); lanes and tubes 1-7, positive samples of 7 farms; lane and tube 8, negative control. |