 |
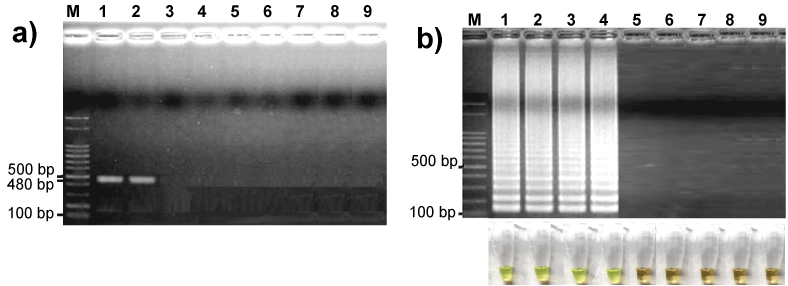
| Figure 4: Comparative analysis of the sensitivity of LAMP and PCR, using a seven dilution series of cDNA as template (a) Electrophoresis analysis of PCR; (b) Electrophoresis analysis and visual detection (SYBR Green I) of LAMP. Left to right: Lane M, DNA size marker (100 bp; Fermentas); Lanes 1-8, 2×10⁷, 2×10⁶, 2×10⁵, 2×10⁴, 2×10³, 2×10², 2×101 and 2×100 CFU/ml, respectively; Lane 9 negative sample. |