 |
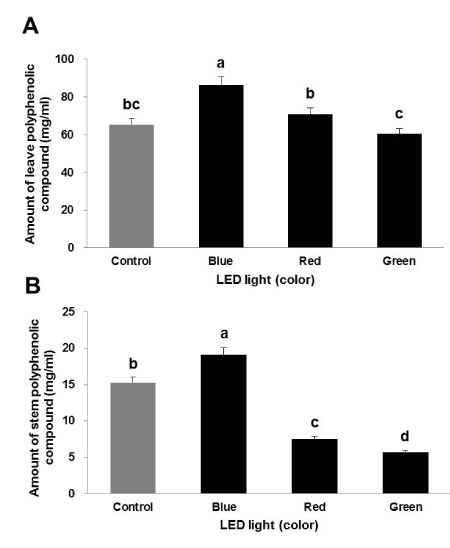
| Figure 2: The content of total polyphenolic compounds in the leaves and stems of tomato grown for 21 days under light-emitting diode (LED) lights. Control represents broad-spectrum-white LED. Error bars represents the standard deviation (n=3). Bars with the same low case letter are not significantly different (p>0.05), as assessed by Tukey’s honestly significant difference. |