 |
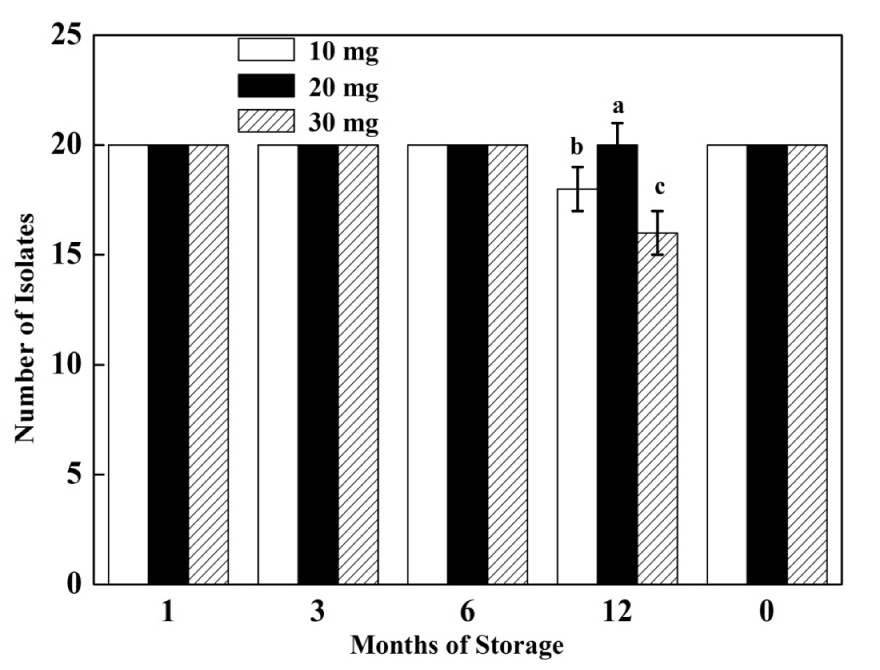
| Figure 2: Relationship between the quantity of conidia and the viability of Bgt conidia after desiccation and storage at -80°C for increasing periods of time. Each bar represents the number of Bgt isolates remaining viable after storage (n=20). Error bars represent the standard deviations of the means (n=3). |