|
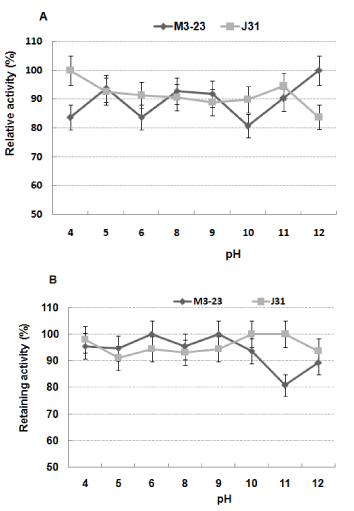
| Figure 6: Effects of pH value on intracellular chitinase activity (A) and stability (B) of V. marismortui strain M3-23 and T. halophilus strain J31. The values shown are percentages of the maximum activity of the enzyme which is taken as 100%. Value is the average from triplicate experiments. Error bars represent the standard deviation. |