 |
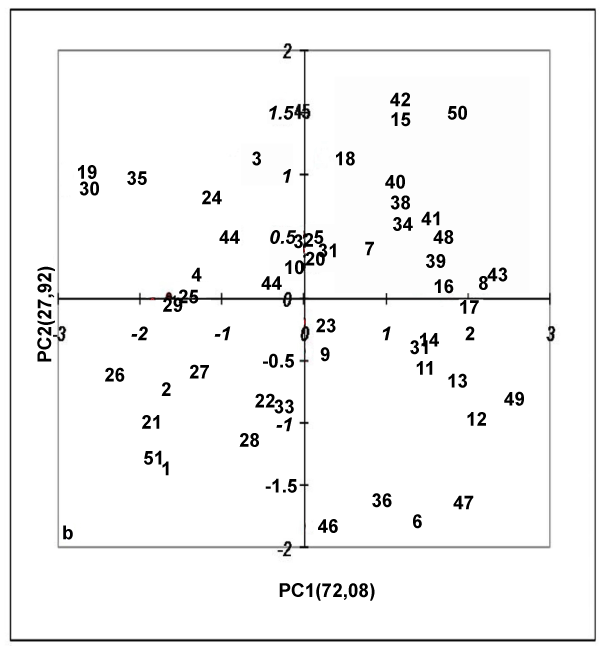
| Figure 2b: Additive main effects and multiplicative interaction (AMMI) biplot showing relative stability of fifty varieties (code 1 to code 50) along with susceptible control (51) over three years for Area Under Disease Progress Curve (AUDPC) with respective PC1 and PC2 scores. |