 |
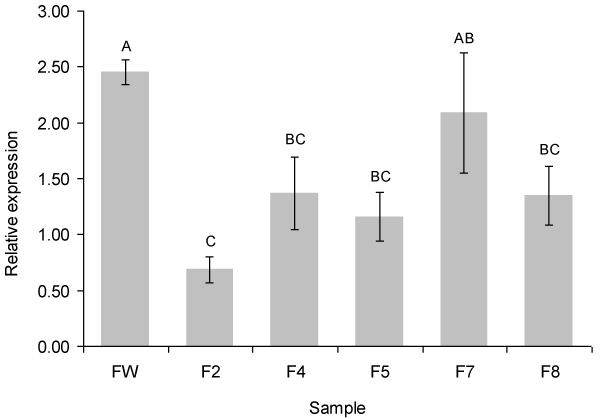
| Figure 5: Quantitative gene expression of CtCut1 transcript in F8-3B wild type (FW) and F8 3B-pAA1 transformants at 6 hours after inoculation (HAI) with Capsicum annuum genotype Bangchang. The Y-axis represents the relative expression in fold change of CtCut1 gene relative to Elongation Factor 1 (EF1) reference gene expression. Bars on graph represent standard error based on mean of two independent experiments. Different letters over the bars indicate significant differences conducted using analysis of variance (ANOVA). LSD (1.034) was calculated at p< 0.05 (n=2). All data derived from three technical replicates per sample per experiment. |