 |
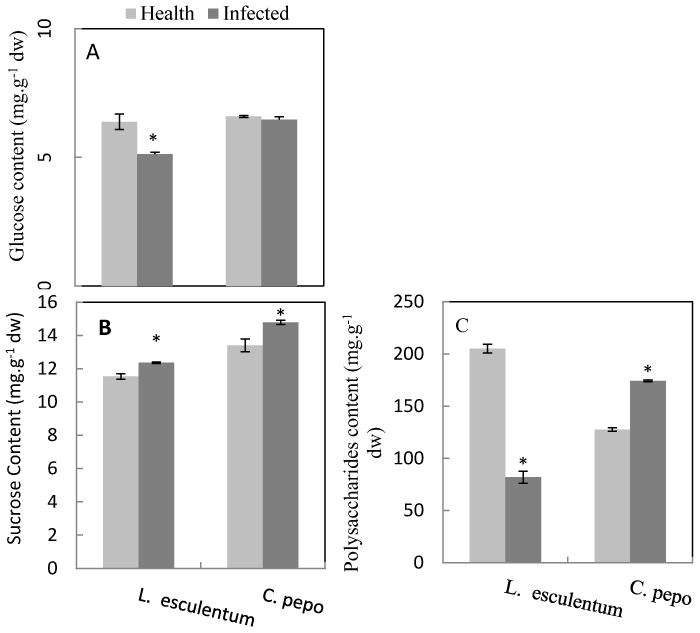
| Figure 12: Changes in the carbohydrate pools (glucose, A; sucrose, B and polysaccharides, C) in TBSV Egh-infected leaves of L. esculentum and C. pepo. Bars are the standard error of the mean. Asterisks show significant differences between infected and health leaves (α/2=0.1). |