 |
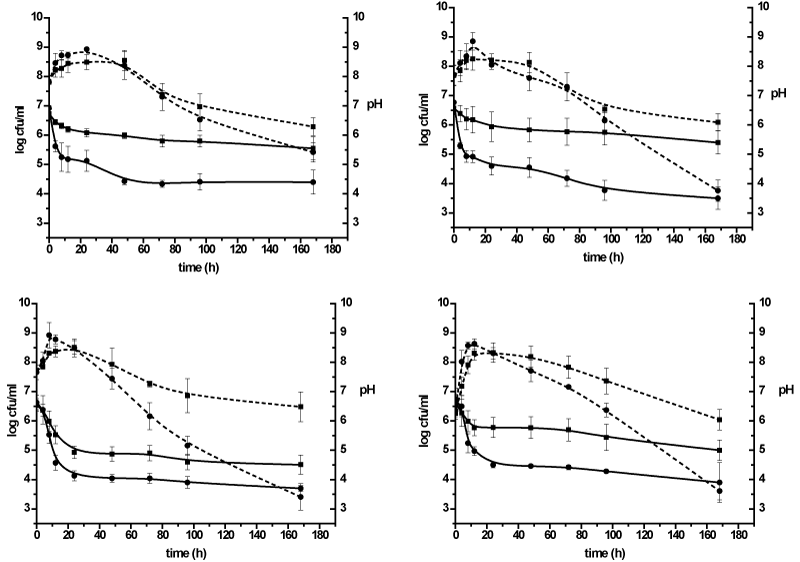
| Figure 2: The growth curves (--) and changes in pH (–) for Fusobacterium, Clostridium, Enterococcus and Escherichia coli bacteria grown in the medium containing TA–dextrin (■) or glucose (control) (●). Results show means and standard deviations of n=3 replicates. |