 |
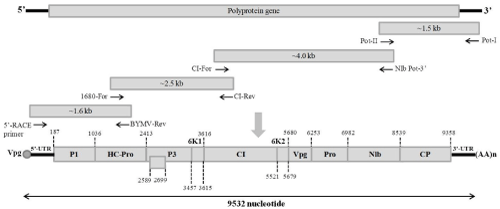
| Figure 4: Schematic representation of full-length potyvirus genome amplified by RT-PCR. Cartoon on the top represents the potyvirus genome. Filled bars along with arrow head (below in black) represent different amplified regions obtained by their respective set of primer pairs. Below the widen arrow, showed the complete genome of potyvirus under study (9532 nucleotide) with organization of different proteins (typical to potyvirus) and their respective positions in genome. |