 |
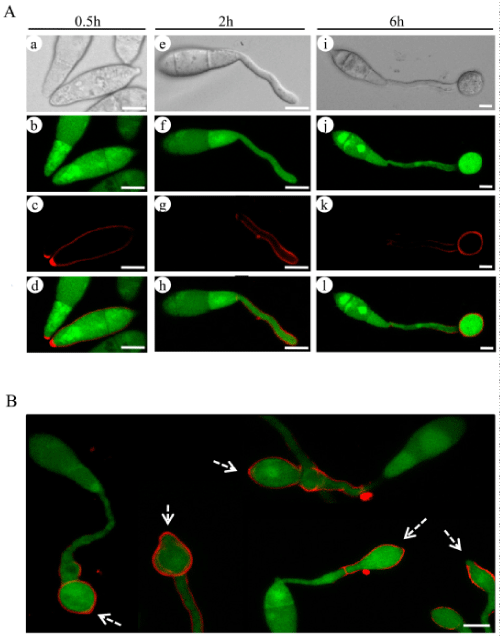
| Figure 4: Confocal fluorescence microscopy analysis of the interaction of TMR-MgAPI16 (shown in red) with gfp-M. oryzae (shown in green). Fungus treated with 10 μM TMR-MgAPI16 was visualized at different times (0.5h, 2h, and 6h). (A) Panels show light microscopic images (a, e, i), excitation of GFP protein (b, f, j), excitation of TMR label (c, g, k) and merge of fluorescent images (d, h, l). (B) Morphological abnormalities resulting of treatment of M. oryzae with TRM-MgAPI16. Treated hyphae show malformations in the appressorium development (arrows) after 6h treatment. Bar = 5 μM. |