 |
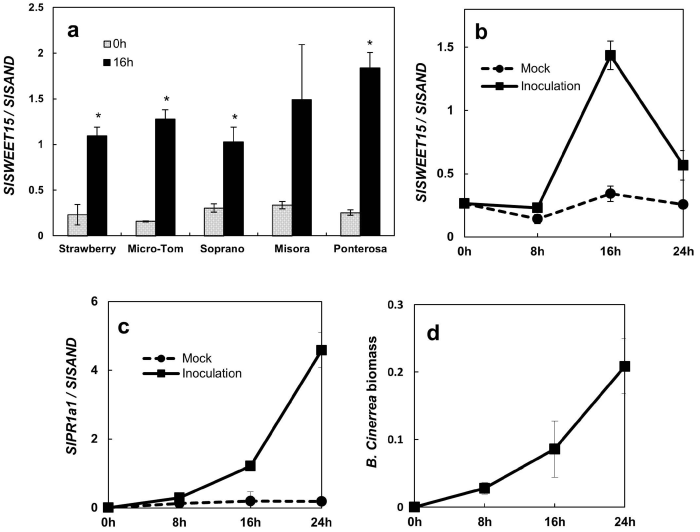
| Figure 2: Expression of the SlSWEET15 gene in different tomato varieties and time course of SlSWEET15 gene expression. (a) Expression of the SlSWEET15 gene was measured by qRT-PCR at 0 h and 16 h post inoculation in 5 different tomato cultivars. Asterisks indicate values that are statistically significantly different from the 0 h control using ANOVA (P<0.05). Expression of SlSWEET15 (b) and SlPR1a1 (c) genes were measured by qRT-PCR at 0, 8, 16 and 24 h post inoculation. In mock inoculations, cotyledons were treated with 1/2 PDB. Transcript levels were normalized to the SlSAND gene. (d) Biomass of B. cinerea was measured with qPCR at the same time points. Values represent the mean and standard error of triplicate results. |