|
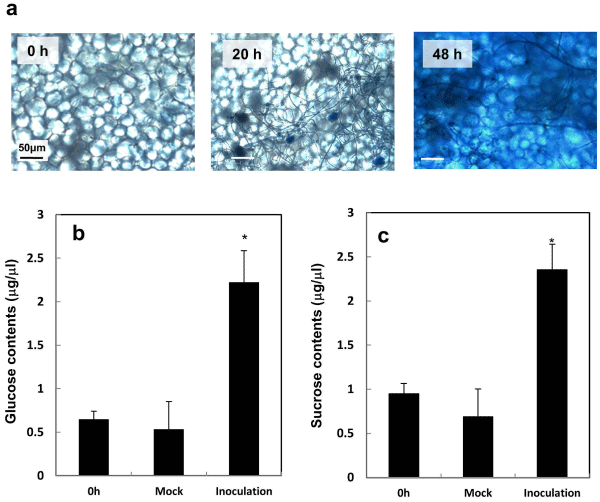
| Figure 3: Sugar contents in apoplasmic fluids of B. cinerea infected cotyledons. (a) Light microscopies of aniline blue stained cotyledons inoculated with B. cinerea spores at 0, 20 and 48 h post inoculation. Note that no cell death was observed by 20 h post inoculation. Glucose (b) and sucrose (c) contents in apoplasmic fluids collected from 0 h, 20 h after mock treated and 20 h post inoculated cotyledons. Values represent the mean and standard error of triplicate results. Asterisks indicate values that are statistically significantly different from the 0 h control using ANOVA (P<0.05). |